 Trade Buddy
The Trading Journal Spreadsheet Template (and When to Drop It)
A trading journal spreadsheet template you can build today: the exact columns, a clean three-tab structure, a real DIY PnL calendar, and when an app wins.

You searched for a trading journal spreadsheet because you want a grid you can fill in tonight, not a sermon about discipline. Fair enough. So here is the template first: the columns that matter, a tab layout that scales, and the formulas that turn a raw log into numbers you can read. Then, once it works, an honest look at the days a spreadsheet quietly lets you down, and the point where moving to an app saves you from yourself.
The columns a trading journal spreadsheet needs
Most blank templates fail because they track price and nothing else. A trade is a decision, so log the decision, not only the fill. Here is a column set that covers a discretionary or rules-based trader without turning data entry into a second job.
| Column | What to enter |
|---|---|
| Date | The day you closed the trade, one row per trade. |
| Instrument | Ticker or pair, like AAPL or EURUSD. |
| Direction | Long or short. |
| Entry | Your average fill price in. |
| Stop | The price where the idea is wrong, set before entry. |
| Target | Your planned exit, if you have one. |
| Size | Shares, contracts, or lots. |
| Risk $ | Dollars at risk if the stop hits (entry to stop, times size). |
| Exit | Your average fill price out. |
| P&L | Net profit or loss after fees. |
| R multiple | P&L divided by Risk $, so a win that pays twice your risk is +2R. |
| Setup | The pattern or reason you took it (breakout, pullback, news). |
| Mistake / Notes | What you did well or broke, in plain words. |
The two columns people skip are the two that pay off: Risk $ and R multiple. Tracking results in R instead of raw dollars lets you compare a 100-share trade against a 1,000-share trade on the same scale. Say you risk $200 and the trade returns $600: in dollars that is one good day, in R it is +3R, the same score whether you traded one share or a thousand. If you are unsure how to set Size and Risk $ in the first place, the math is in our guide on how to calculate position size.
A three-tab structure you can build
One flat sheet works for a week. After that you want three tabs that feed each other.
- Trades: your raw log, one row per trade, using the columns above. This is the only tab you type into by hand.
- Daily: one row per calendar day that rolls up the Trades tab. Net P&L per day comes from
=SUMIF(Trades!A:A, A2, Trades!J:J), where column A is Date and J is P&L. Put a daily trade count and a daily win count next to it. - Dashboard: the summary you check. Win rate is
=COUNTIF(Trades!K:K, ">0") / COUNTA(Trades!K:K)if K holds R multiple. Average win, average loss, and expectancy live here too.
Expectancy is the number that tells you whether the whole approach has an edge: average R per trade, or (win rate times average win) minus (loss rate times average loss). A figure above zero means the system makes money over a long run of trades, even with plenty of red along the way. For the rest of the numbers worth a tile on this tab, see the trading metrics that matter.
Build a DIY PnL calendar with conditional formatting
A spreadsheet can fake the best feature of a dedicated journal: the colored month. Lay out a seven-column grid on a new tab, one cell per calendar day, and pull each day’s net from the Daily tab. Then add two conditional-formatting rules to the range:
- Green fill when the cell value is greater than 0.
- Red fill when the cell value is less than 0.
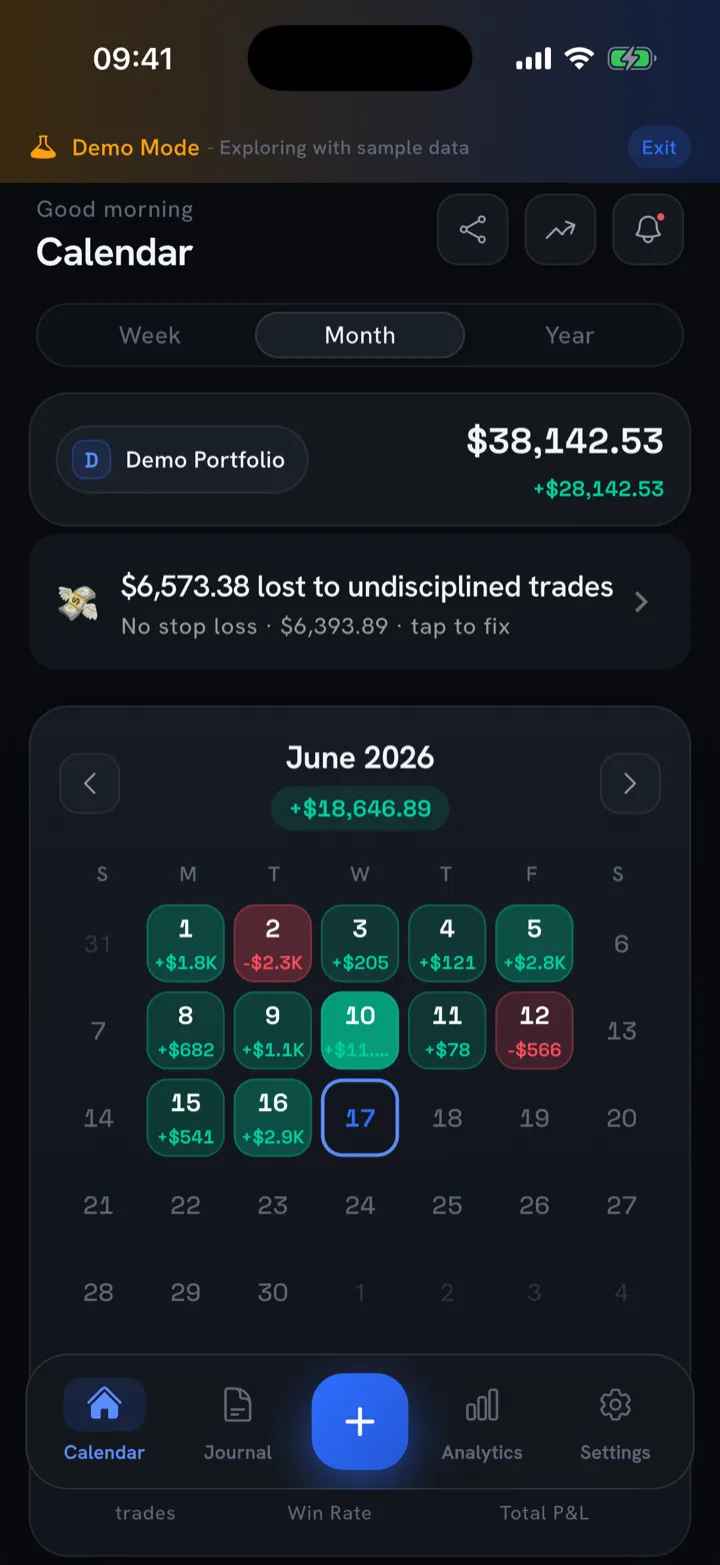
Now your month reads as a map instead of a column of figures. Green clusters, red streaks, and that one oversized red box all jump out. If you have not seen why this view changes how traders behave, start with what a PnL calendar is. Building it by hand is a good way to understand it. Maintaining it by hand is where the trouble starts.
Where the spreadsheet breaks
The template above is genuinely useful, and for some traders it is enough. But spreadsheets fail in predictable places, and they tend to fail exactly when you need them most.
- Upkeep collapses on red days. After three losers you do not want to open a sheet and type the damage in by hand. So you skip it. The missing rows are the trades you most needed to study.
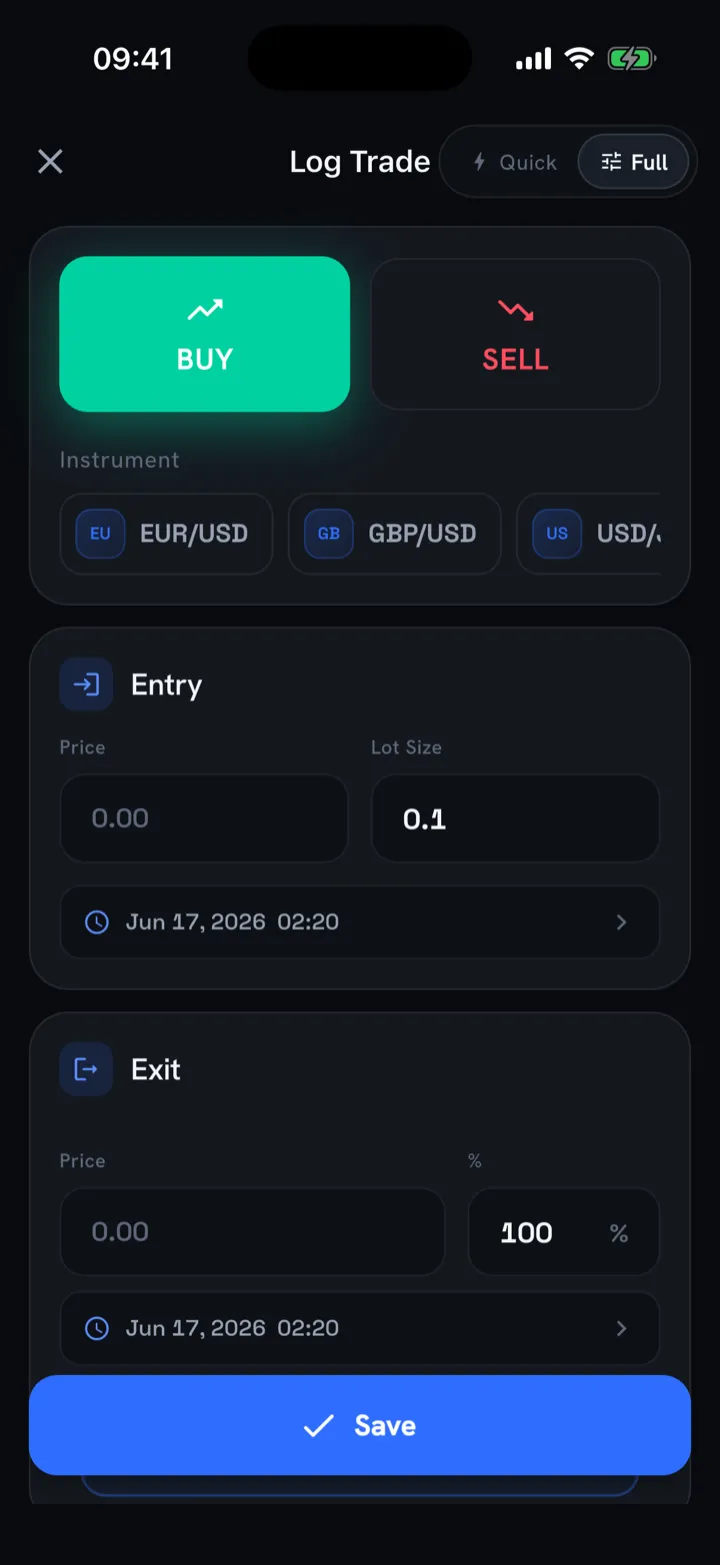
- No real phone entry. Editing a multi-tab workbook on a phone between sessions is painful, so logging waits until you are at a desk, and by then the detail is gone.
- Manual fill entry is error-prone. Copying entry, exit, size, and fees by hand invites typos, and one wrong cell quietly poisons your win rate and expectancy.
- Formulas rot. Insert a row in the wrong place, drag a fill the wrong way, and a SUMIF silently points at the wrong range. You trust a dashboard that is now lying to you.
That last point matters. A journal you half-trust is worse than none, because you make decisions on numbers you assume are clean.
Spreadsheet vs app: an honest comparison
Neither option is right for everyone. Here is the trade-off without the sales pitch.
| Trading journal spreadsheet | Dedicated app | |
|---|---|---|
| Cost | Free | Free tier, paid plans for depth |
| Upkeep | Manual every trade | Log in seconds, often from a screenshot |
| Mobile | Awkward at best | Built for the phone |
| Auto-import | None, you type it all | Reads MT4, MT5, cTrader, TradingView screens |
| Analytics | Whatever you build | Win rate, R, expectancy, drawdown, ready-made |
| Discipline | Depends on willpower | Low friction keeps the streak alive |
A spreadsheet wins on cost and on full control. An app wins on the thing that decides whether a journal works: whether you keep using it on the bad days.
When to graduate to an app
You do not need to abandon the spreadsheet on day one. Move when you hit these signs:
- You have stopped logging after losses, so your data has holes right where the lessons are.
- You trade from your phone but journal from a laptop, so entries pile up and detail fades.
- Your formulas have broken at least once and you no longer fully trust the dashboard.
When that day comes, an app removes the friction that killed the habit. Screenshot import means a screen from MetaTrader becomes a logged trade without retyping a single fill; the details are in importing MT4 and MT5 trades. The metrics you hand-built are already there, explained in plain English, so you read them instead of debugging a COUNTIF. And if you are on iPhone, the best trading journal app for iPhone comparison covers what to look for.
How Trade Buddy replaces the spreadsheet
Trade Buddy is the three-tab template rebuilt as an app, minus the upkeep. You log a trade in seconds, or import one from a screenshot of MT4, MT5, cTrader, or TradingView. The PnL calendar draws itself in green and red, with no conditional-formatting rules to babysit. The analytics cover win rate, green days, average win and loss, R multiple, expectancy, Sharpe, Sortino, and max drawdown, each with a plain-English explainer. Your data stays on the device, and there is no account to create. It is free to start, with paid plans for deeper analytics when you want them.
The bottom line
Build the spreadsheet. Genuinely, build it: typing out the columns and formulas teaches you what a trade costs and what your edge looks like. Then watch how often you keep it up on the days that hurt. The best trading journal is the one you still fill in after a string of red, and friction is what decides that. None of this is financial advice, and a journal will not hand you an edge by itself. It makes the edge you have impossible to ignore. Get Trade Buddy free on the App Store.
Frequently asked questions
Is Excel good for a trading journal?
Excel is fine for starting a trading journal: it is flexible, free if you already own it, and easy to customize. The catch is upkeep. Excel cannot import broker trades or log from your phone, so entry stays manual, and that is where most journals die after a few losing days. It works until friction beats willpower.
Is there a free trading journal spreadsheet template?
You can build one in minutes using the columns and three-tab layout above (Trades, Daily, Dashboard), and Google Sheets or Excel cost nothing if you already have them. A free app is the other route: Trade Buddy starts free, draws the PnL calendar for you, and skips the manual formula upkeep entirely.
What columns should a trading journal spreadsheet have?
At minimum: date, instrument, direction, entry, stop, size, exit, and net P&L. Add risk in dollars and R multiple so you can compare trades of different sizes on one scale, plus a setup tag and a short note on what you did well or broke. Those last fields turn a log into a teacher.
Should I use a spreadsheet or an app for my trading journal?
Start with a spreadsheet if you want full control and zero cost and you trade from a desk. Switch to an app once you notice gaps in your log after losing days, since that is when journaling matters most. The right tool is the one you keep using, not the most powerful one.
Can a spreadsheet show a PnL calendar?
Yes. Lay out a seven-column grid, one cell per day, pull each day's net from a daily tab, then add conditional formatting: green when the value is above zero, red when it is below. It works, but you rebuild and check the rules by hand every month, which is the upkeep a dedicated app removes for you.