How to Use Trade Buddy: A Step-by-Step Walkthrough (With Screenshots)
A visual, step-by-step guide to using Trade Buddy on iPhone — explore the demo, build your PnL calendar, log a trade in seconds, read your analytics and let the AI coach find your leaks.

Most trading-journal guides tell you why journaling matters and then leave you staring at an empty app. This one is the opposite. It’s a screen-by-screen walkthrough of Trade Buddy on iPhone — exactly what you’ll see, in the order you’ll see it, from the first launch to reading the analytics that tell you where your money actually goes. Every screenshot below is the real app, so by the end you’ll know how to use Trade Buddy without guessing.
If you’re still deciding whether an iPhone journal is worth it at all, start with the buyer’s checklist and come back. If you’ve already downloaded it, follow along.
Step 1: Explore the demo before you commit anything
Open the app for the first time and you don’t hit a login wall — you land inside a fully populated demo account. Real-looking trades, a colored calendar, working analytics. You can tap around the entire app before deciding to set up your own portfolio.
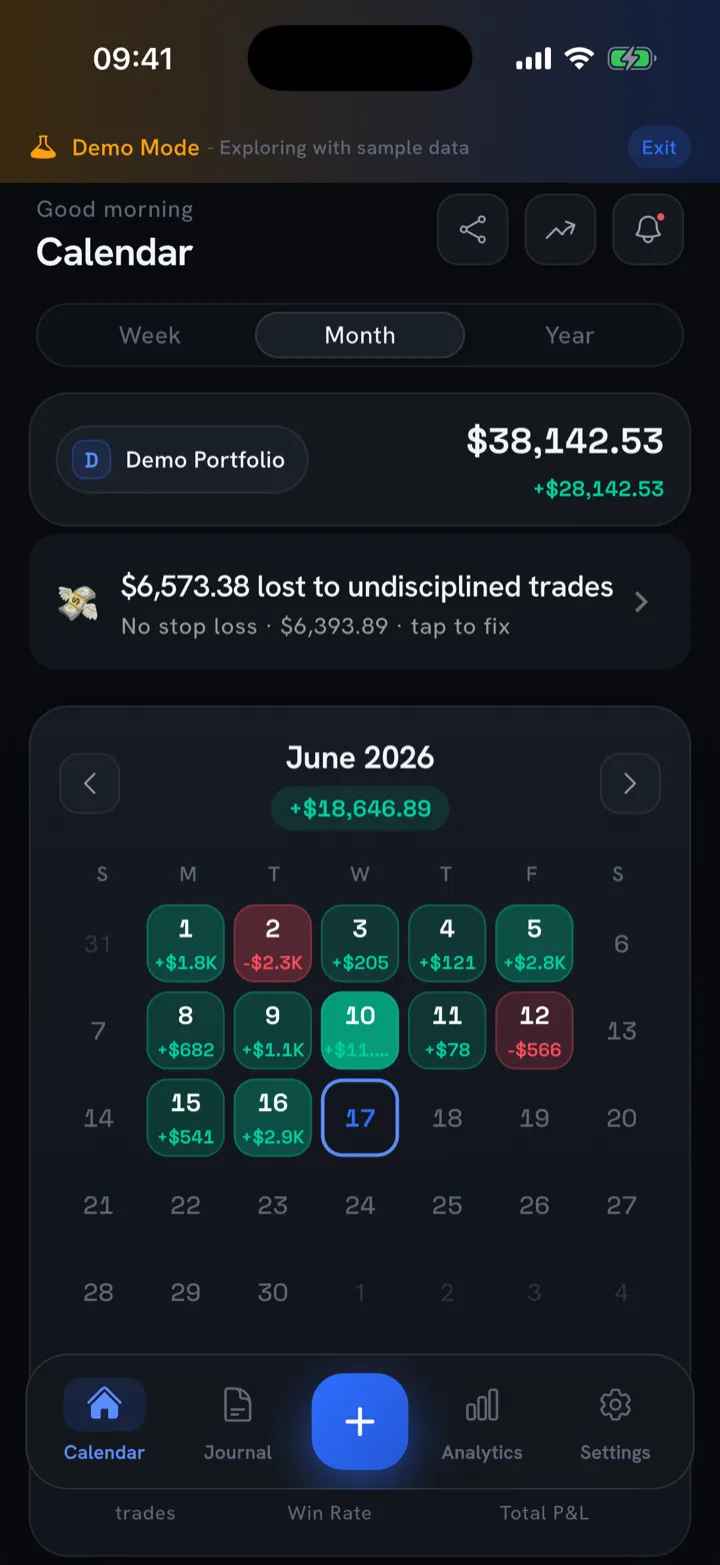
That’s the home screen: a monthly PnL calendar. Each day is colored by result — green for a profit day, red for a loss day — with the day’s P&L printed right on the tile. The header sums the month (here, +$18,646.89), and the banner up top flags how much was lost to undisciplined trades. The “Demo Mode” strip means none of this is your data yet; it’s a sandbox to learn the layout in.
When you’re ready to track real trades, the app swaps the demo for your own account in one short screen.
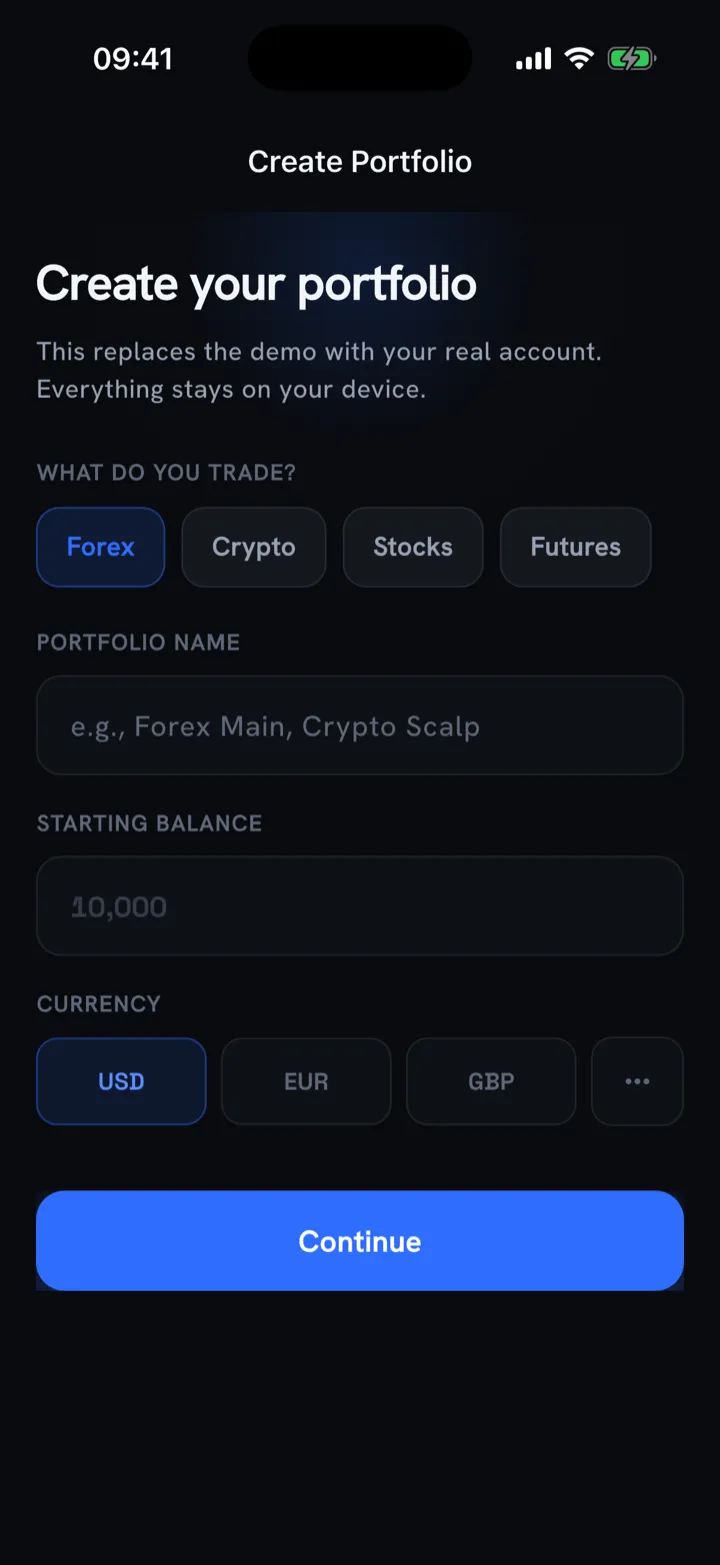
Pick what you trade (Forex, crypto, stocks, futures and more), name the portfolio, set a starting balance and currency, and tap Continue. No email, no password — your data stays on the device. That privacy-first, on-device default is one of the criteria we weight heavily in the buyer’s guide.
Step 2: Log a trade in seconds
The blue + button in the center of the tab bar is how you add a trade from anywhere in the app. Tap it and you get the Log Trade sheet.
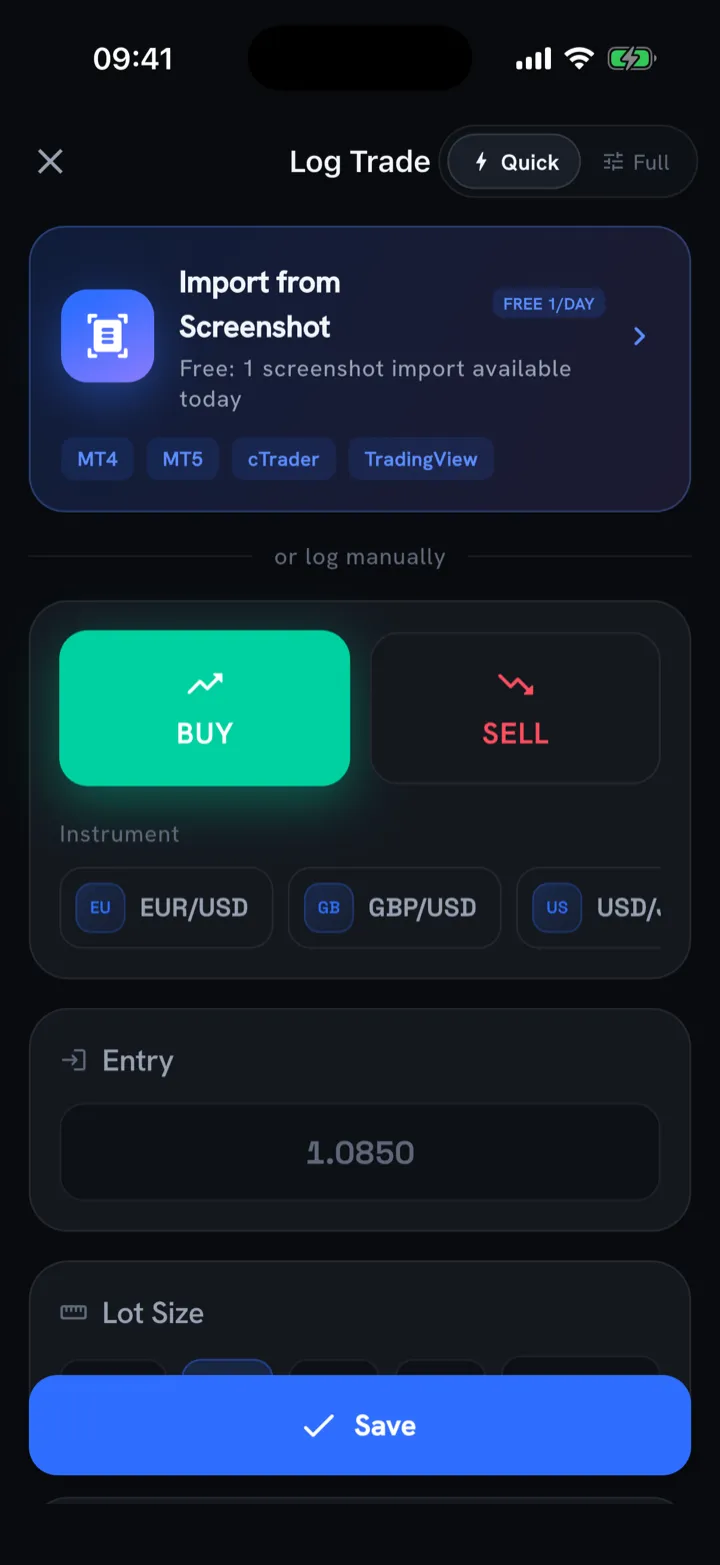
There are two ways in. Quick mode (shown above) captures the essentials — direction, instrument, entry, lot size — in a handful of taps, which is what you want when you’re logging on the move. Or skip typing entirely with Import from Screenshot: snap your broker’s trade-history screen from MT4, MT5, cTrader or TradingView and let the app read the fills.
Switch to Full mode when you want the complete record.
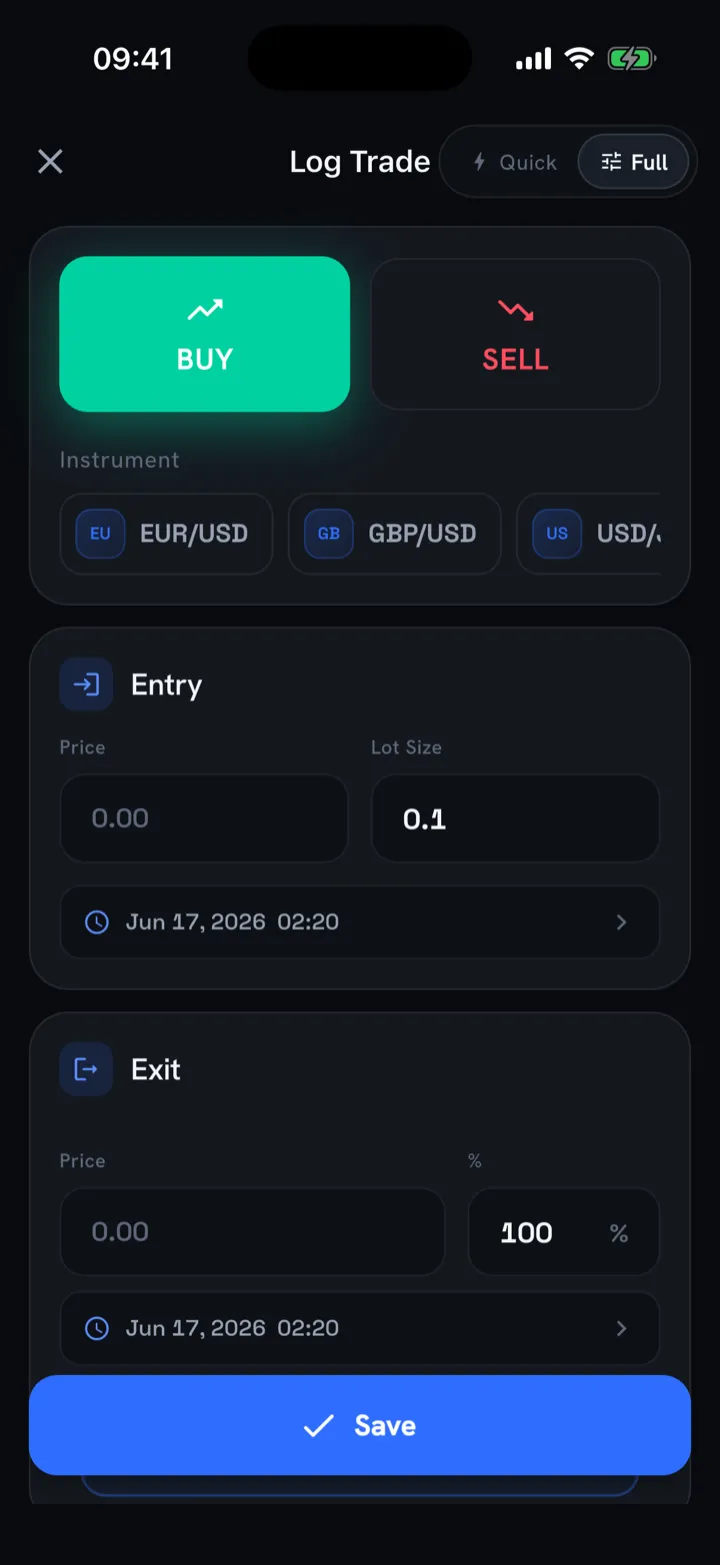
Full mode adds exit price, partial-close percentage, precise timestamps and room for the context that makes a journal useful later — notes, tags, a strategy and how you felt taking the trade. The golden rule still applies: if logging takes longer than the trade felt, you’ll stop doing it, so use Quick on busy days and Full when you’re reviewing.
Already have months of history on MetaTrader? Don’t type it by hand — see how to import MT4 and MT5 trades.
Step 3: Review a day, then a single trade
Back on the calendar, tap any colored day to expand the trades behind that number.
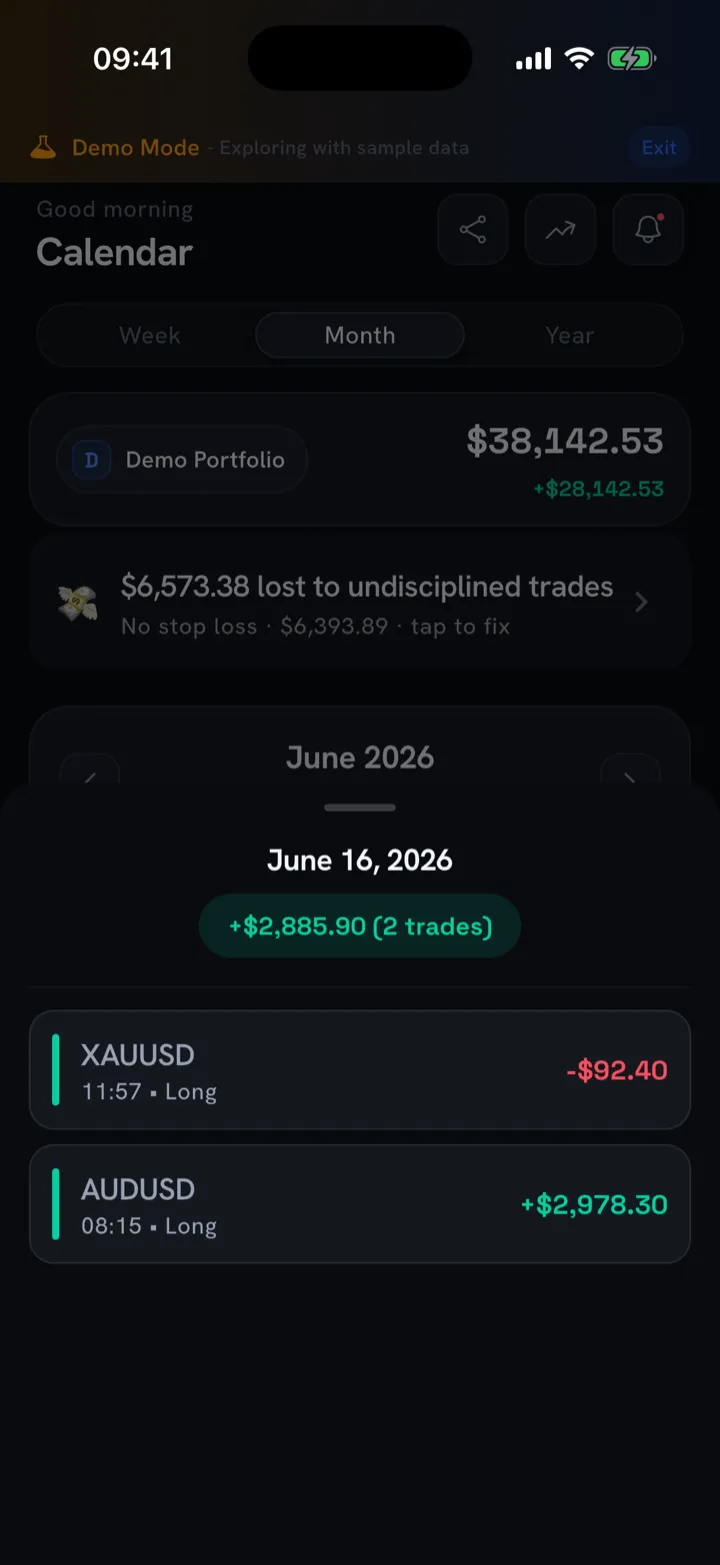
The day sheet shows each trade’s instrument, time, direction and result — so a green day that was secretly one big winner covering three losers stops hiding from you. Tap a trade to open its full detail.
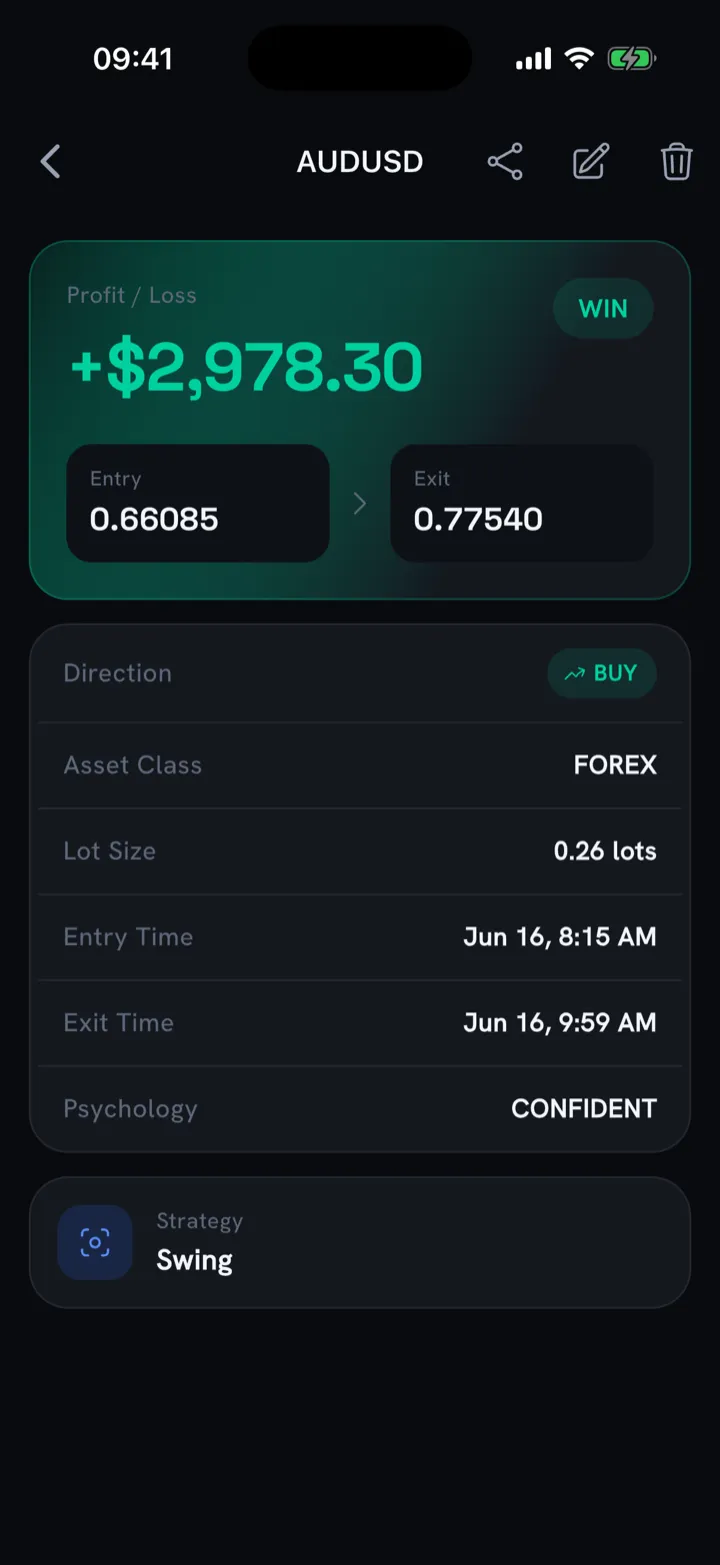
This is where journaling earns its keep. The trade card carries the entry and exit, direction, asset class, lot size, exact times — and the two fields most apps skip: the psychology you logged (“Confident”) and the strategy you ran (“Swing”). Over a few weeks those tags are what let you ask the useful questions: do my “confident” trades actually win more than my “revenge” ones? For the why behind reviewing your own decisions, see the journaling guide.
Step 4: Read the analytics that matter
Tap the Analytics tab. The top of the screen is a single trading-health score out of 100, broken into discipline, risk and consistency.
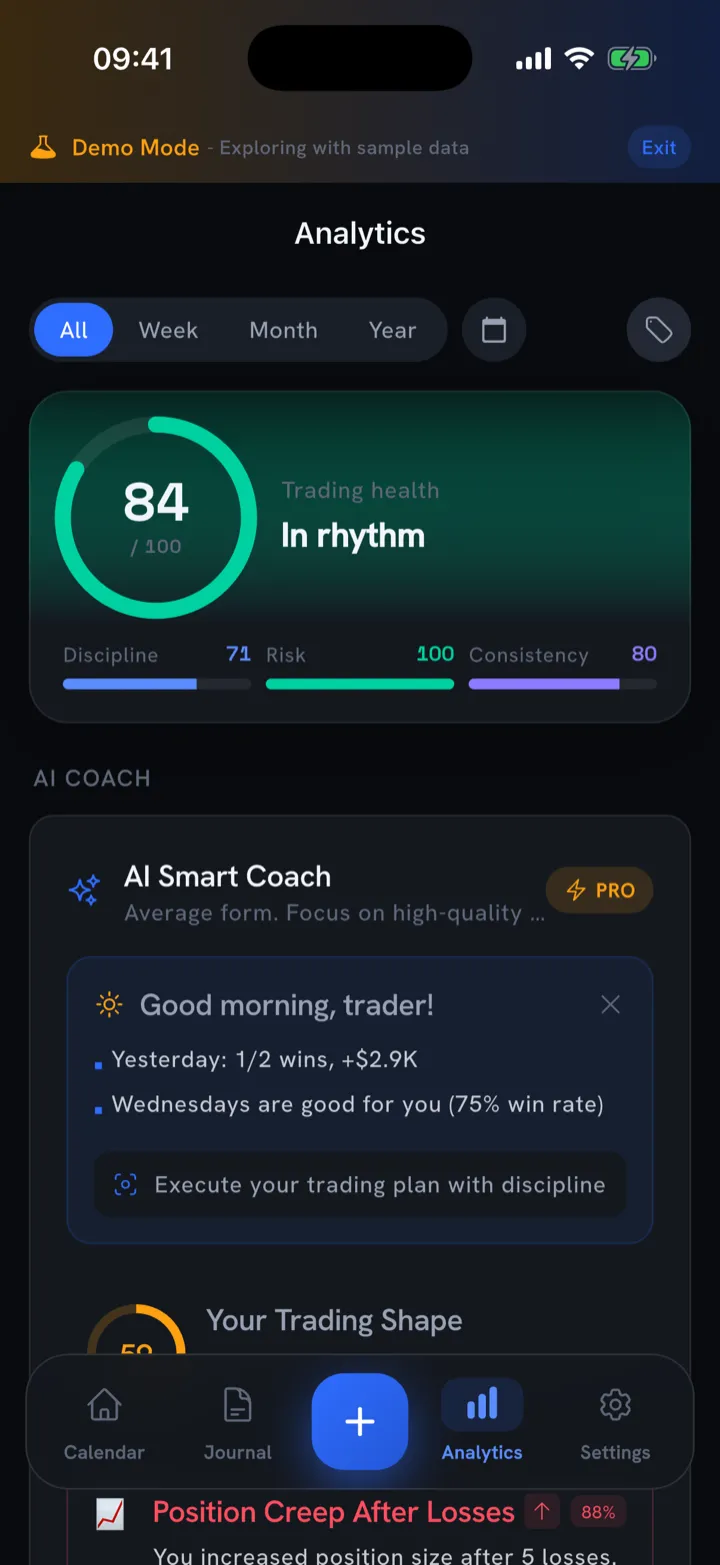
One number to glance at, three sub-scores to explain it. Below the gauge sits the AI coach, which reads your logged trades and writes a plain-English briefing — recent results, the days that work for you, and a nudge to follow your plan. It’s the difference between a dashboard you admire and one that tells you something.
Scroll down for the Performance Overview: win rate, average risk-reward, total trades and your current streak, with deeper risk-adjusted metrics a tap away.
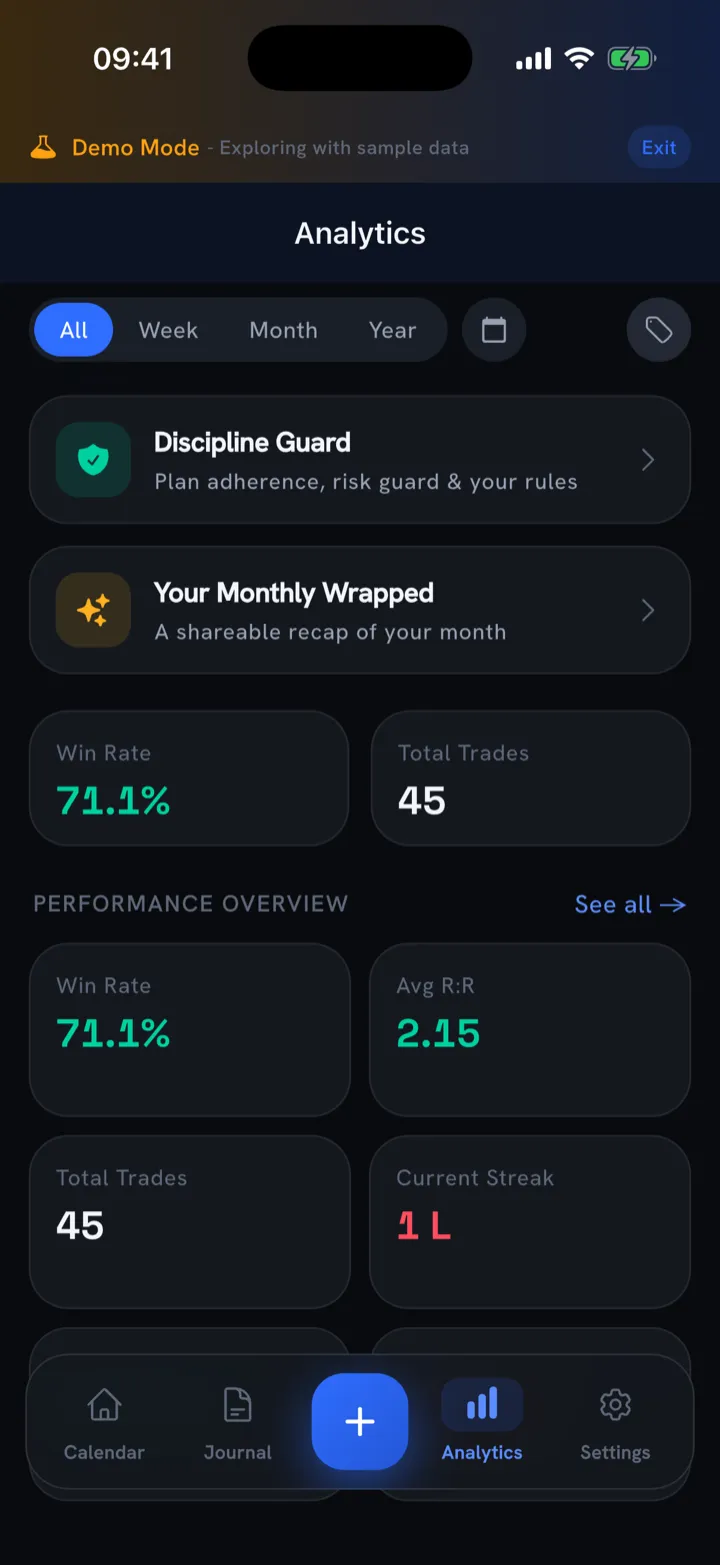
Win rate alone is a vanity number — a 90% win rate can still lose money if the 10% are huge. That’s why the average R:R sits right next to it. We rank the metrics worth your attention, and the ones to ignore, in the trading metrics that matter.
Step 5: Let the AI coach find your leaks
Keep scrolling in Analytics and the coach moves from summary to specifics — pattern detection across your own history.
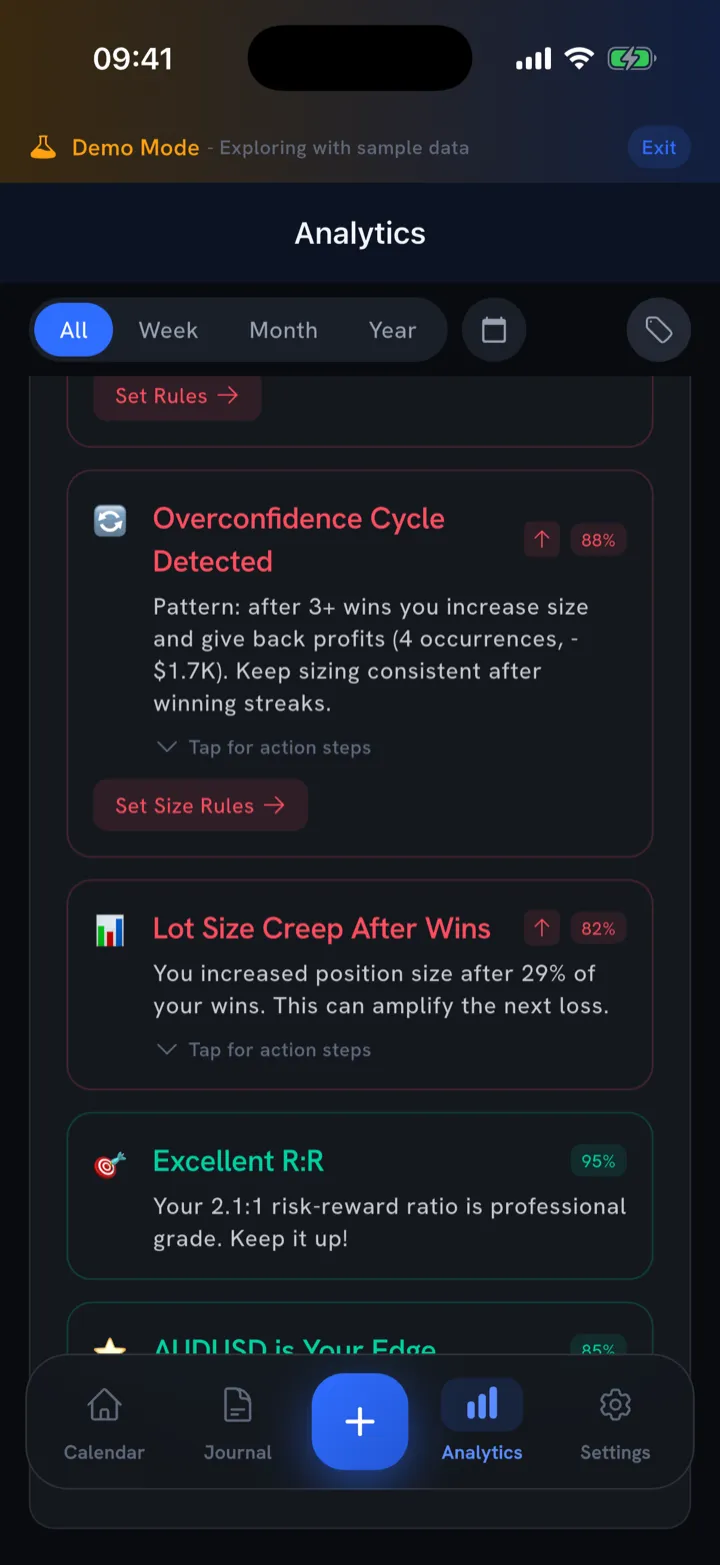
Each card is a pattern with a confidence score. Some are leaks — “Overconfidence Cycle Detected: after 3+ wins you increase size and give back profits” — and each one comes with action steps and a button to turn it into a hard rule. Crucially, the coach also surfaces your edges: “Excellent R:R — your 2.1:1 ratio is professional grade” and “AUDUSD is your edge.” A coach that only ever flatters you is useless; this one points at both.
The most common leak it catches is sizing up after a loss to “win it back.” If that’s your pattern, pair these alerts with the system in how to stop revenge trading.
Step 6: Set rules that protect the account
Insight is only half the job — the other half is a wall between a bad moment and a bad position. Open Settings → Trading rules to reach the Discipline guard.
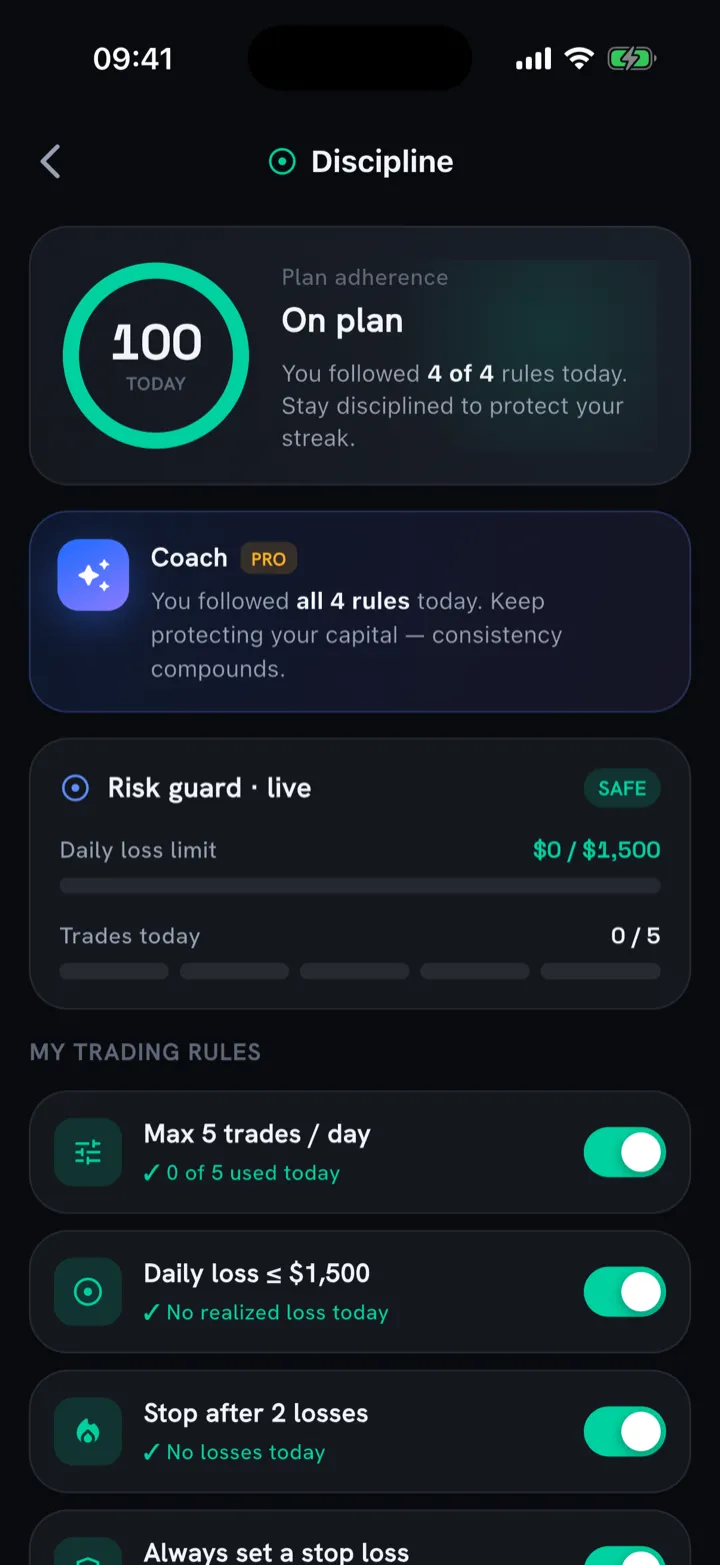
Here you set your own guardrails — a max number of trades per day, a daily loss limit, “stop after two losses,” “always set a stop loss” — and the app tracks them live. The risk guard counts your trades and realized loss against your limits in real time, and a plan-adherence score turns following your process into its own scoreboard. Hit 100 today and you protected the streak, win or lose.
Step 7: Import history and keep everything in sync
Last, the housekeeping that keeps the journal honest. Settings → Import Trades is your bulk on-ramp.
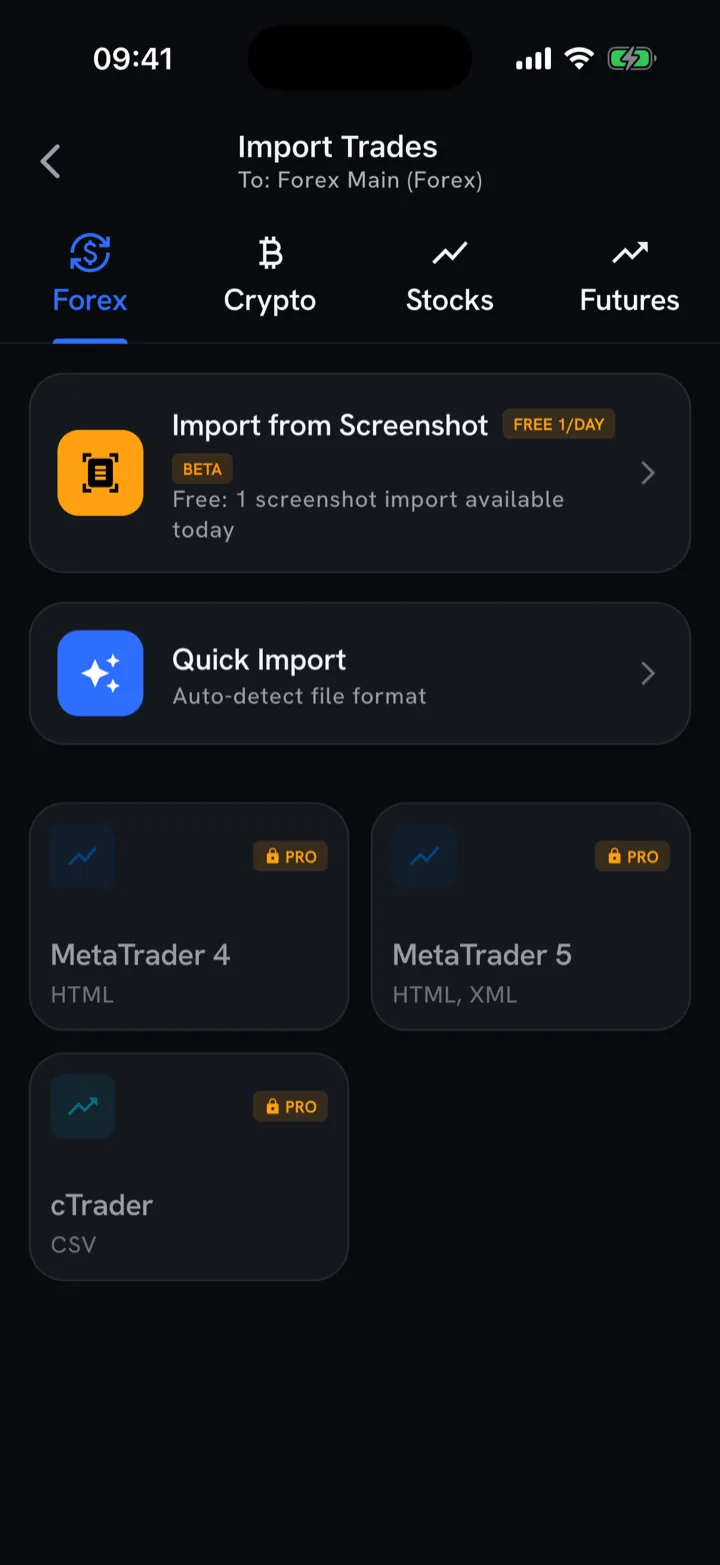
Bring in a backlog from MT4, MT5 or cTrader, drop in a CSV, or use the daily free screenshot import for one-offs. The same screen offers broker auto-sync and a built-in economic calendar, and on Pro your journal syncs across iPhone and iPad via iCloud. Manual logging is great until a heavy week buries you — imports are what keep a gap from becoming the reason you quit.
You now know how to use Trade Buddy
That’s the whole loop: explore the demo → set up a portfolio → log fast → review each day → read the analytics → act on the coach → enforce your rules. Run that loop every evening and the calendar fills in, the patterns surface, and the numbers start telling you the truth about your trading.
The patterns only appear once your trades are in it, so the best next step is to log one. Download Trade Buddy free on the App Store, or see the interactive PnL calendar and pricing first.
One honest note that applies to any journal: it’s a tool for reviewing your own decisions, not financial advice. The edge comes from what you do with the patterns it shows you.